The way we increased the return on ad spend (ROAS) and boosted the turnover of an online store with PPC

Webernetic - photo 6 Webernetic - photo 7
THE CLIENT HAS CHOSEN TO REMAIN ANONYMOUS

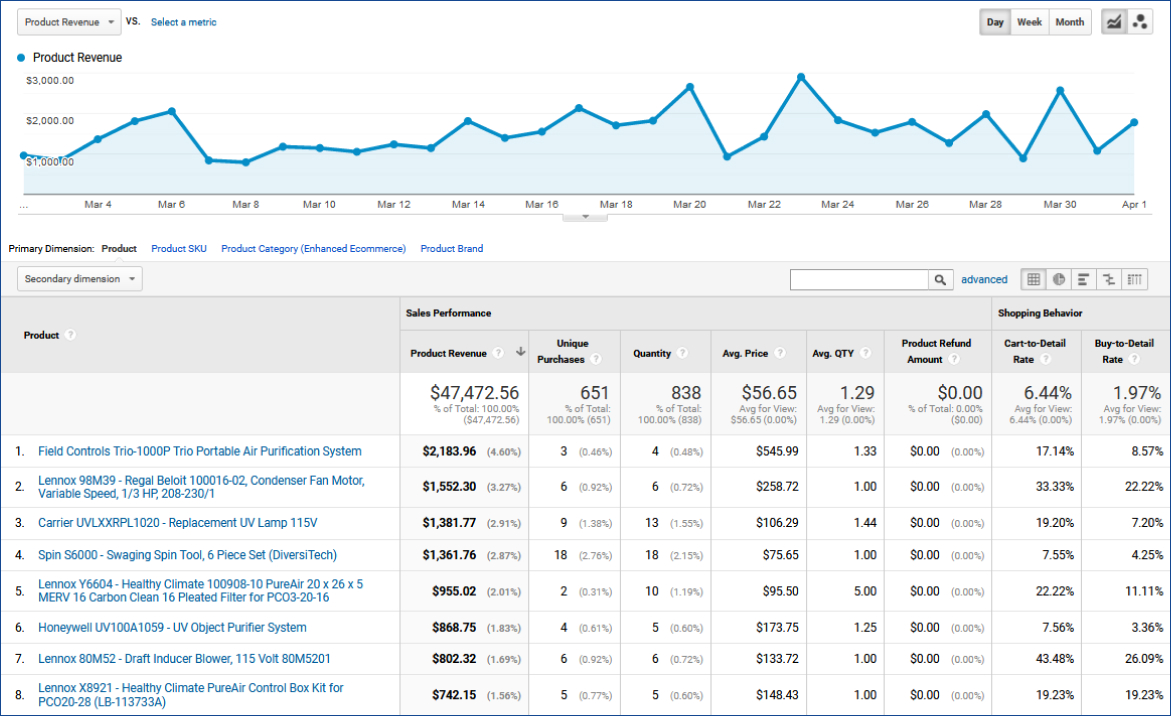
The client was an online store selling equipment for ventilation, heating and air conditioning sys-tems. The online store owner wanted to increase the return on investment in contextual advertis-ing and boost the store's turnover. There were several sales channels, but the data available were only on the profitability of cooperation with the Amazon platform.

The initial state of the project was as follows:

The client set up and ran a sales campaign in Google Shopping for 6 months and implemented the strategy of maximizing clicks at the lowest price. Only the cost of advertising and the number of purchases through the shopping cart were known to our client, but the ROAS remained un-clear. This took place because a lot of goals that were unimportant for the business were set up in Ads Manager: viewing the contact page, put-in-the-shopping-cart actions which hindered the efficiency analysis in the account and were uninformative. It lacked the most important part – the tracking of calls and processed or already paid orders.

The activities on the project were undertaken in several phases:

The first-phase

The beginning of activities - March, 2020
Objective: To boost the ROAS up to 600%.

Our actions to complete the task included:

  1. In order to understand the current situation, we set up enhanced e-commerce data track-ing. Our team organized the transfer from the online store and to Google Analytics of data on user shopping behavior patterns as well as information on sold products and transac-tion amounts (Google Analytics Enhanced E-commerce).
  2. Our specialists configured the reception and processing of the above mentioned data in Google Analytics.
  3. We spent 30 days collecting statistics.

The interface of Google Analytics began to show product sales performance:

Webernetic - photo 8

And revenue
by sales channels:

Webernetic - photo 9

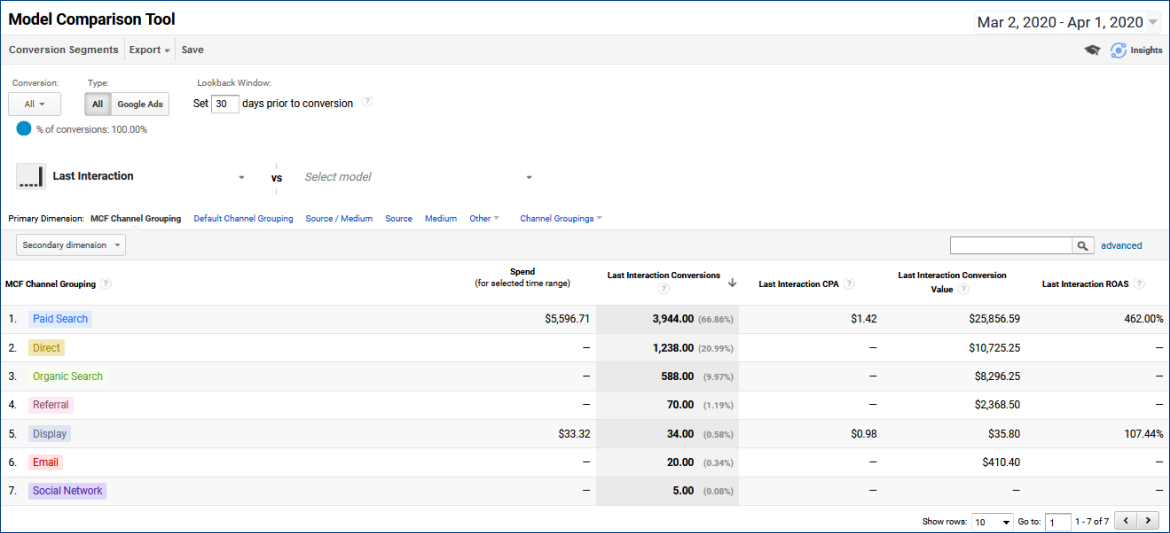
A month later, it became obvious that the current return on investment was 462% in sales cam-paigns and 100% in media campaigns — which meant that the store's revenue was approxi-mately equal to the cost of advertising.

Webernetic - photo 10

Then we handled the account:

  1. Our specialists removed the tracking of every conversion and replaced them with e-commerce data with linear attribution.
  2. We conducted a detailed analysis of the actual user requests for the last three months (about 30,000), compiled a list of stop words and connected it to the campaign.
  3. Our team disabled
    the ads display in the media network due to the low efficiency;
    some product categories that showed low profitability;
    the ads display in several states with unprofitable sales.

These activities provided the automatic bid management algorithm with correct statistical data and this was the key factor of its proper functioning.

The results:

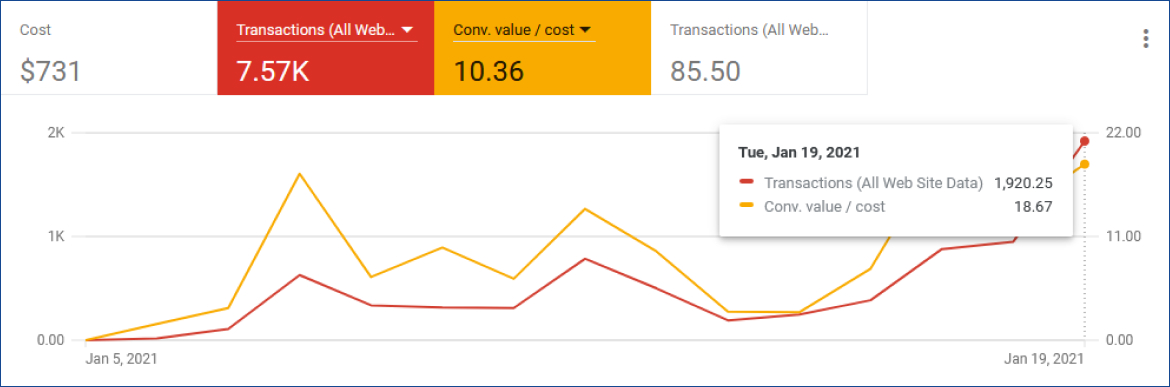
By June, the revenue was 24.5%, advertising costs decreased by 10%, and the ROAS in-creased from 479% in early April to 659% in early June:

Webernetic - photo 11

We also noticed that the sales numbers of the store depended on external factors and the prod-uct range stability, so we compared two-week or monthly intervals. The chart shows the drop in all indicators on the day of the beginning of the riots in the United States on May 26, 2020 after the death of George Floyd:

Webernetic - photo 12

The second phase

The aim: To increase the store's turnover.

Working on the project, we noticed that the automatic strategy target return on ad spend (ROAS) had a certain side effect: AI could significantly limit ads display to users whose purchase making probability was lower than the required value. The audience of ads displaying expands, if the target return indicator is reduced.

Webernetic - photo 13Webernetic - photo 14

In this regard, we decided:

  1. To get the margin data on each product of the store from the client.
  2. To divide the products into groups by margins with making this division automatic: when the margin of individual products changes, they should automatically move to another group.
  3. To create separate campaigns for product groups with different margins and set different levels of ROAS.

The steps undertaken:

  1. We calculated the acceptable target return for the product groups with different margins and got the following values:Webernetic - photo 15
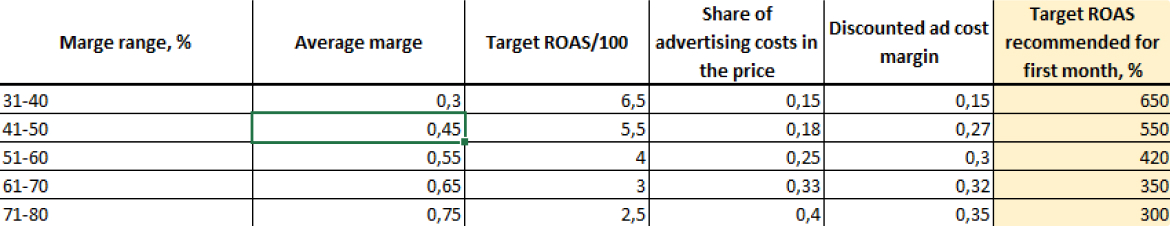
  2. Thus, we came to the conclusion that it was profitable to spend 1/3 of the revenue for high-margin products and 1/6 of the revenue for low-margin products on the advertising. In any case it would be unprofitable to sell the products of this particular store with their margins below 15% in Google Shopping at any reasonable values of ROAS.

  3. On the basis of the product margin chart our team created an additional static feed in Google Merchant Center, which added a margin column for each product to the dynamic product feed.
  4. We launched 5 Google Shopping sales campaigns involving products which fell under the filtering rules based on the margin column.
  5. Set different ROAS values for each campaign.

The result of the activities undertaken manifested itself as the daily revenue increase up to $1,900 per day for 2 weeks of the algorithm's learning process, and later, at the peak of sales, it boosted even more - $2,250 per day:

Webernetic - photo 16

As a result, we managed to achieve the indicated objectives:

• the ROAS increase up to 659%;

• the daily revenue boosted from $1,340 to $2,250 per day.

Webernetic - photo 17
Up